Update
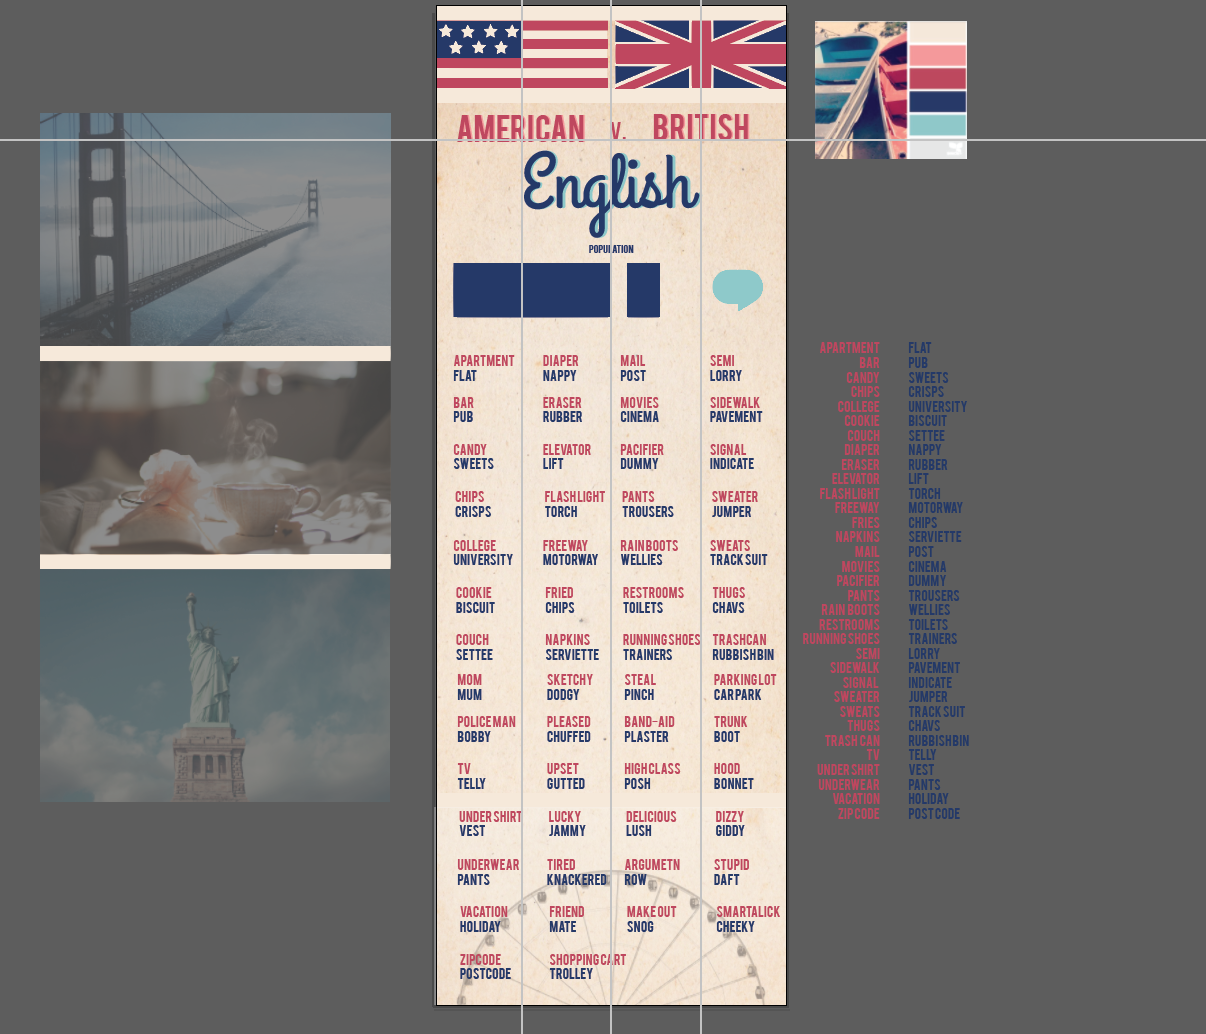
My info graphic still needs a lot of work, but I have all of my text of my graphic and I have been working on my graph. I am trying to create a Statue of Liberty and Big Ben to represent the populations of America and Britain. I’m really struggling with the Statue of Liberty. I have an idea of what I want, but I am not certain how to make it happen. Maybe I need to sketch out more ideas and styles. I’m debating if I want it to be a flat design or if I want it a little more 3D?
Also, I am trying to decide how to organize my information. I don’t want the words to be in lists like it shows. I’m thinking about putting the text in speech bubbles and organizing them by categories: Car Stuff, Food Stuff, Clothing, Expressions, etc… I probably have too much text and will need to eliminate some, but that is ok.

Timeline:
Oct. 5 – 10: Collect all research & Data. Plan out organization of graphic, and begin sketching.Oct. 12- 17: Create sketches, get feedback, pick color scheme, and begin creating vectors.Oct. 19: Get all text on- Oct. 22 – 24: Complete all vectors – Still working on this one
- Oct. 25 Get critique on first draft, refine
- Oct. 25-26: Get more feedback and refine again
- Oct. 28 – Finalize infographic and get posted to the blog